
Technical analysis is a technique traders use to evaluate past price data to predict future price movements. While traders can use many different technical indicators, some of the most popular include moving averages, Fibonacci retracements, and support and resistance levels.
When applying technical analysis to the FX market, it is vital to remember that currency pairs move in long-term trends. As such, traders should look for technical indicators that can identify these trends and help them make trade decisions accordingly.
Moving average
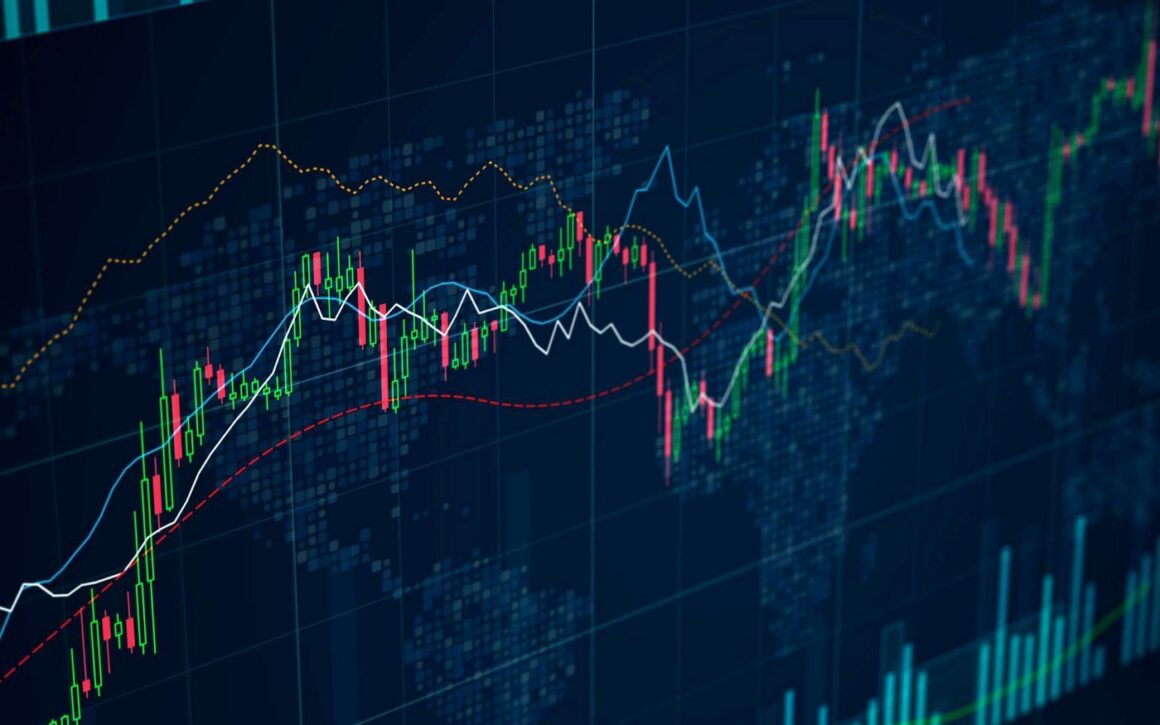
One of FX traders’ most popular technical indicators is the moving average. It’s simply a line plotted on a chart that shows the average price of a currency pair over a certain period.
There are many different moving averages, but the most commonly used ones in FX trading are the simple moving average (SMA) and the exponential moving average (EMA). SMAs are calculated by taking the sum of all prices over a specified period and then dividing that number by the total number of prices in that same period. On the other hand, EMAs place more weight on recent data points, making them more responsive to price changes.
Fibonacci retracements
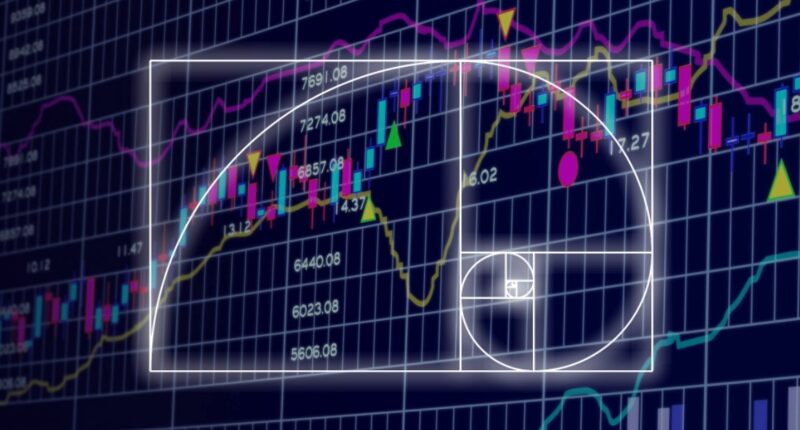
Another popular technical indicator used by FX traders is Fibonacci retracements. Fibonacci ratios are often used in technical analysis to identify support and resistance levels and potential turning points in the market.
The Fibonacci retracement procedure starts at the high of a recent price movement and then divides that line into sections based on the Fibonacci ratios of 23.6%, 38.2%, and 61.8% (38.2 percent, 61.8 percent). These levels may be used as possible resistance and support levels.
Another important concept in technical analysis is support and resistance. Support refers to a level where prices have previously found the bottom, while resistance is a level where prices have previously hit the ceiling. You can identify these levels by looking for horizontal lines on a price chart. Once these levels are identified, traders can watch for price action at these levels to make trade decisions.
Candlestick charts
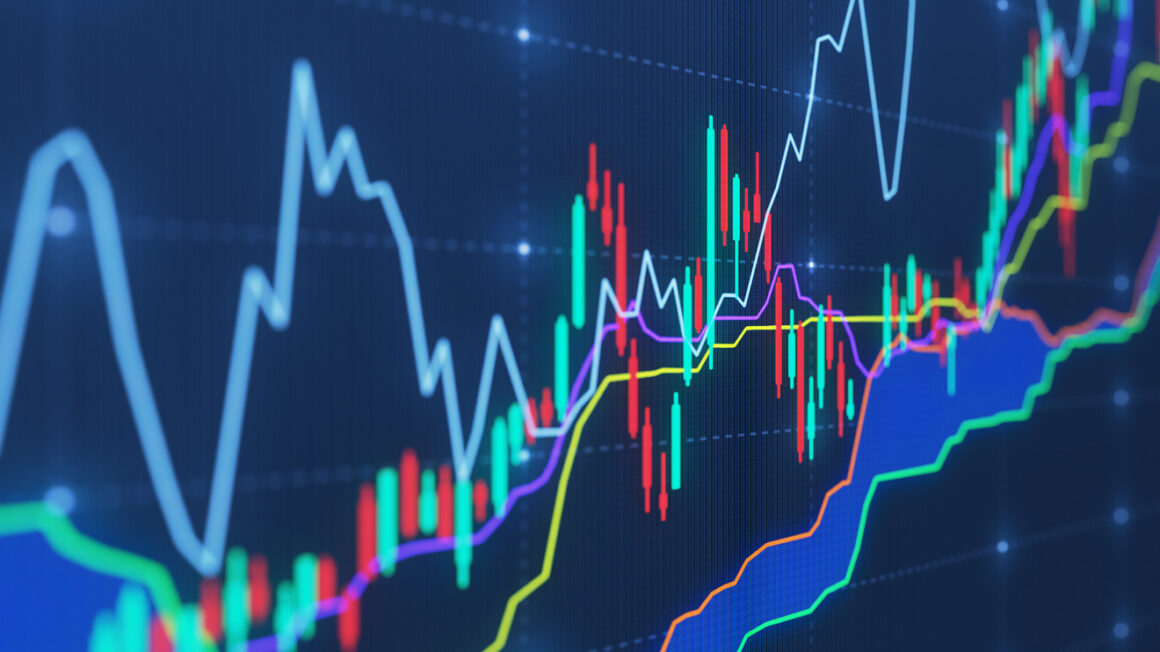
In addition to looking at price action, another popular way to analyze the FX market is through candlestick charts. Candlestick charts provide a more detailed look at price action than traditional bar charts.
Each candlestick on a chart represents the open, high, low, and close prices for a certain period. The bodies of the candlesticks represent the difference between the open and close prices, while the wicks represent the high and low prices. You can use candlestick patterns to identify potential turning points in the market. Some of the most common candlestick patterns include engulfing patterns, dojis, and hammer and hanging man patterns.
Bollinger Bands
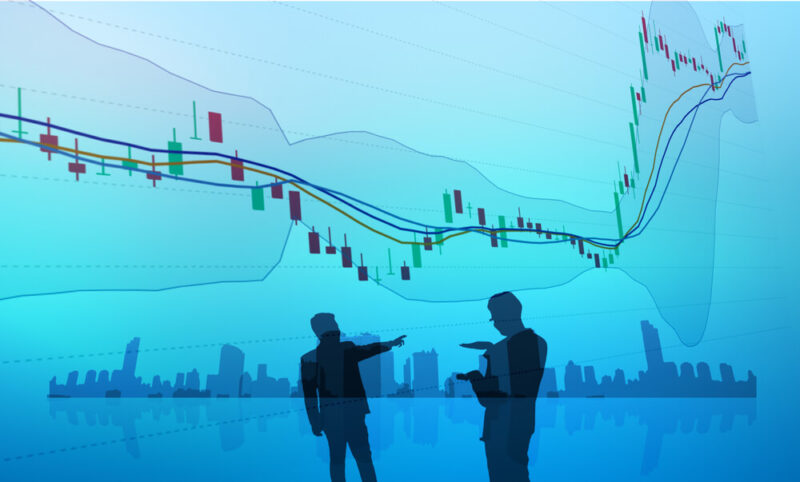
Another technical indicator that FX traders commonly use is Bollinger Bands. Bollinger Bands are a type of statistical tool that is used to measure volatility in the market.
The Bollinger Band indicator consists of two plotted lines on a price chart. The upper Bollinger Band is typically set two standard deviations above the 20-day moving average, while the lower Bollinger Band is set two standard deviations below the 20-day moving average.
You can use Bollinger Bands to identify potential trade opportunities. When prices move outside of the Bollinger Bands, it is often seen as an indication that prices will move back towards the middle of the band.
MACD
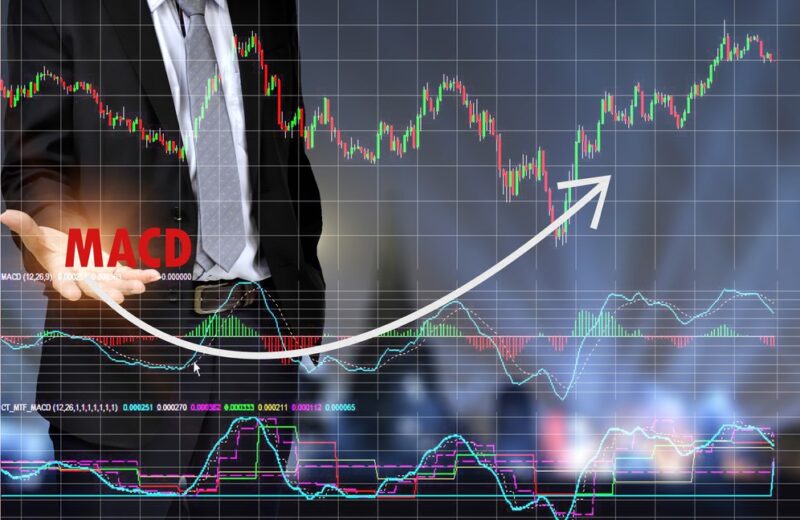
The Moving Average Convergence Divergence (MACD) is a frequently utilized technical indicator FX traders use. The MACD is a momentum indicator that consists of two lines: the MACD line and the signal line.
The MACD line is calculated by subtracting the 26-day exponential moving average from the 12-day exponential moving average. The signal line is generated by averaging the MACD line for nine days. You can use the MACD indicator to identify potential trade possibilities. When the MACD line rises above the signal line, a buy indication is generated, and a sell indication is given when it falls below the signal line.
If you are interested in technical analysis, read more here.